
Dashboards on Urban Health Using the MedSat Dataset
The MedSat dataset provides a rare and valuable view into the intersection of environmental conditions, healthcare trends, and demographics across England. By combining high-resolution satellite imagery with detailed tabular data—including prescription rates, environmental indicators, and sociodemographic metrics—MedSat enables new forms of cross-disciplinary research.
However, the dataset’s scale and complexity pose a significant barrier to accessibility. Covering all of England’s Lower Layer Super Output Areas (LSOAs), it represents a vast and heterogeneous resource that can be difficult to navigate without appropriate tools.
To address this, we are developing interactive web-based dashboards that make MedSat’s data explorable and actionable. The aim is to enable researchers, policymakers, and interested citizens to engage with curated analyses directly in the browser, without the need for technical expertise or specialized software.
The main challenge is designing an intuitive interface that integrates diverse analytical methods, supporting meaningful exploration across multiple data types. Each student project presents a focused case study, which are complex and in-depth analyses at the intersection of health, environment, and society, delivered through an accessible interactive dashboard.
All projects are 2025 final-year MSc dissertation projects in Advanced Computing, conducted within the Department of Informatics at King’s College London, under the supervision of Linus Dietz.
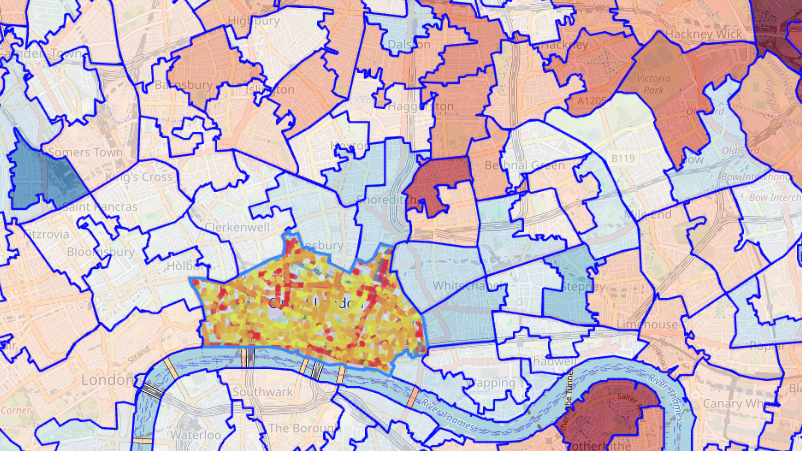
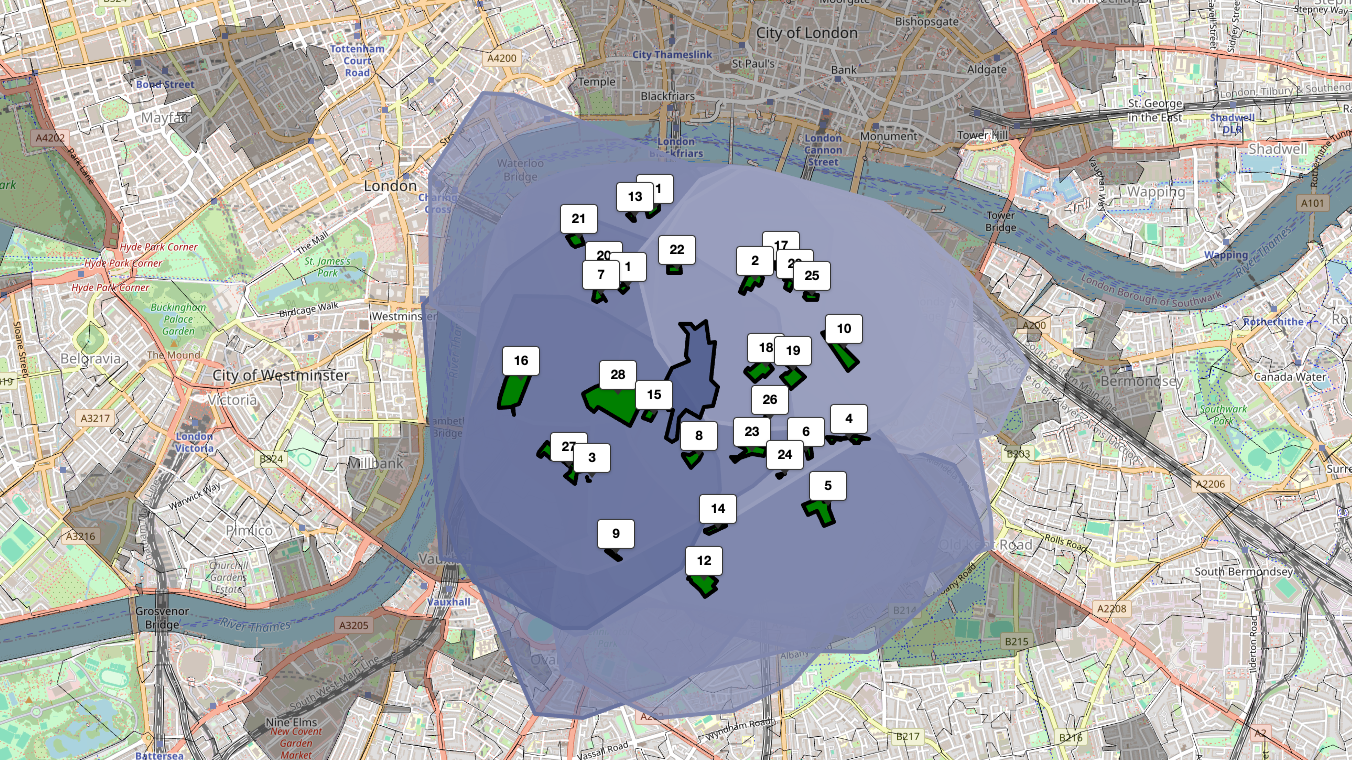
Assessing Community Pavement Infrastructure Needs Using Satellite, Medical and Sociodemographic Data
This study proposes calculation and inductive methods for pavements lengths. Skeletonisation is applied for estimating pedestrian routes in pedestrian priority zones. Pavements that overlay or connect, but which are partially in green spaces, are extracted. All pavement length results are clipped by Lower Layer Super Output Area edges that are established by the UK government. Multiple linear regression models and residual analyses are performed to verify accuracy between different areas. The results show four high explanatory powers of R2 equal to 0.412, 0.466, 0.500, and 0.502. All of the results in this study are presented in an intelligible visualisation platform for a wide range of usages, including the public sector, the general public, and for further study.